Illinois
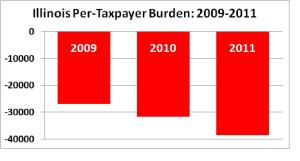
According to analysis by the Institute for Truth in Accounting, Illinois does not have enough assets available ($23.2 billion), to pay the state’s bills, ($182.3 billion).  The difference, $159.2 billion, divided by the number of taxpayers in the state, is the per-taxpayer burden: $38,500 in 2011. Only six states–Alaska, North Dakota, South Dakota, Utah, Nebraska, and Wyoming–achieved a per-taxpayer surplus in 2011.
Illinois lagged far behind the 180 day goal time between the close of its fiscal year and release of its 2011 Comprehensive Annual Financial Report (CAFR), publishing the report 337 days after the fiscal year-end. The timeliest states—Utah (120 days), Washington (145), and New York (154)—published their CAFRs well before the 180 day deadline. The worst states barely finished before the end of the next fiscal year; South Dakota and New Mexico both took 356 days to publish their CAFRs.
The Institute for Truth in Accounting has a unique, comprehensive methodology to analyze all state assets and liabilities, including unreported pension and retirement health liabilities. The result is shown as the per-taxpayer surplus or liability, the difference in each state’s assets and liabilities divided by the number of taxpayers in the state.
More detail on Illinois’s assets and liabilities can be found in the Illinois State of the State (2011).
- Illinois is a Sinkhole State, one of the five worst states in its per-taxpayer burden for the fiscal years 2009, 2010, and 2011.
- With an average personal income of $44,140, Illinois taxpayer burden grew to 81% of a year’s income, an increase of over 10 percentage points.
- Illinois’s financial reports disclose only $29.7 billion of retirement liabilities, leaving $98 billion undisclosed. Compared to the amount undisclosed in 2010 ($86.8 B), this represents an increase of over 10%.
- Illinois’ per-taxpayer burden increased to $38,500 in 2011, an increase of over 20%. The state’s rank fell two spots to 49th.
- Outbound moves from Illinois in 2011 were 60.8% of total, highest in the nation, reflecting business and citizen concerns about the state’s economic health.
- Illinois’s ‘Net Revenue’ (total general revenue less total net expenses) has been negative in every year since 2007, and in six of the past seven years. This number does not include changes in undisclosed liabilities such as pensions and other retirement obligations. According to the state’s own numbers, Illinois repeatedly did not satisfy its budgetary duties. Read more on ‘Net Revenue‘.
Read More: http://www.statedatalab.org/state_data_and_comparisons/detail/illinois
Truth in Accounting


Thanks for pointing me in the right direction as to where I may move to someday,,,soon. Real tired of them taking more of my income in taxes and fees. IL is the pits!
We are in deep trouble. I can’t believe that our State Legislators feel they can do this to the people of Illinois. North Dakota has their own state bank, so this is why they are not in the red and did not feel the cruch of the economic downturn.